The Beats of My Life
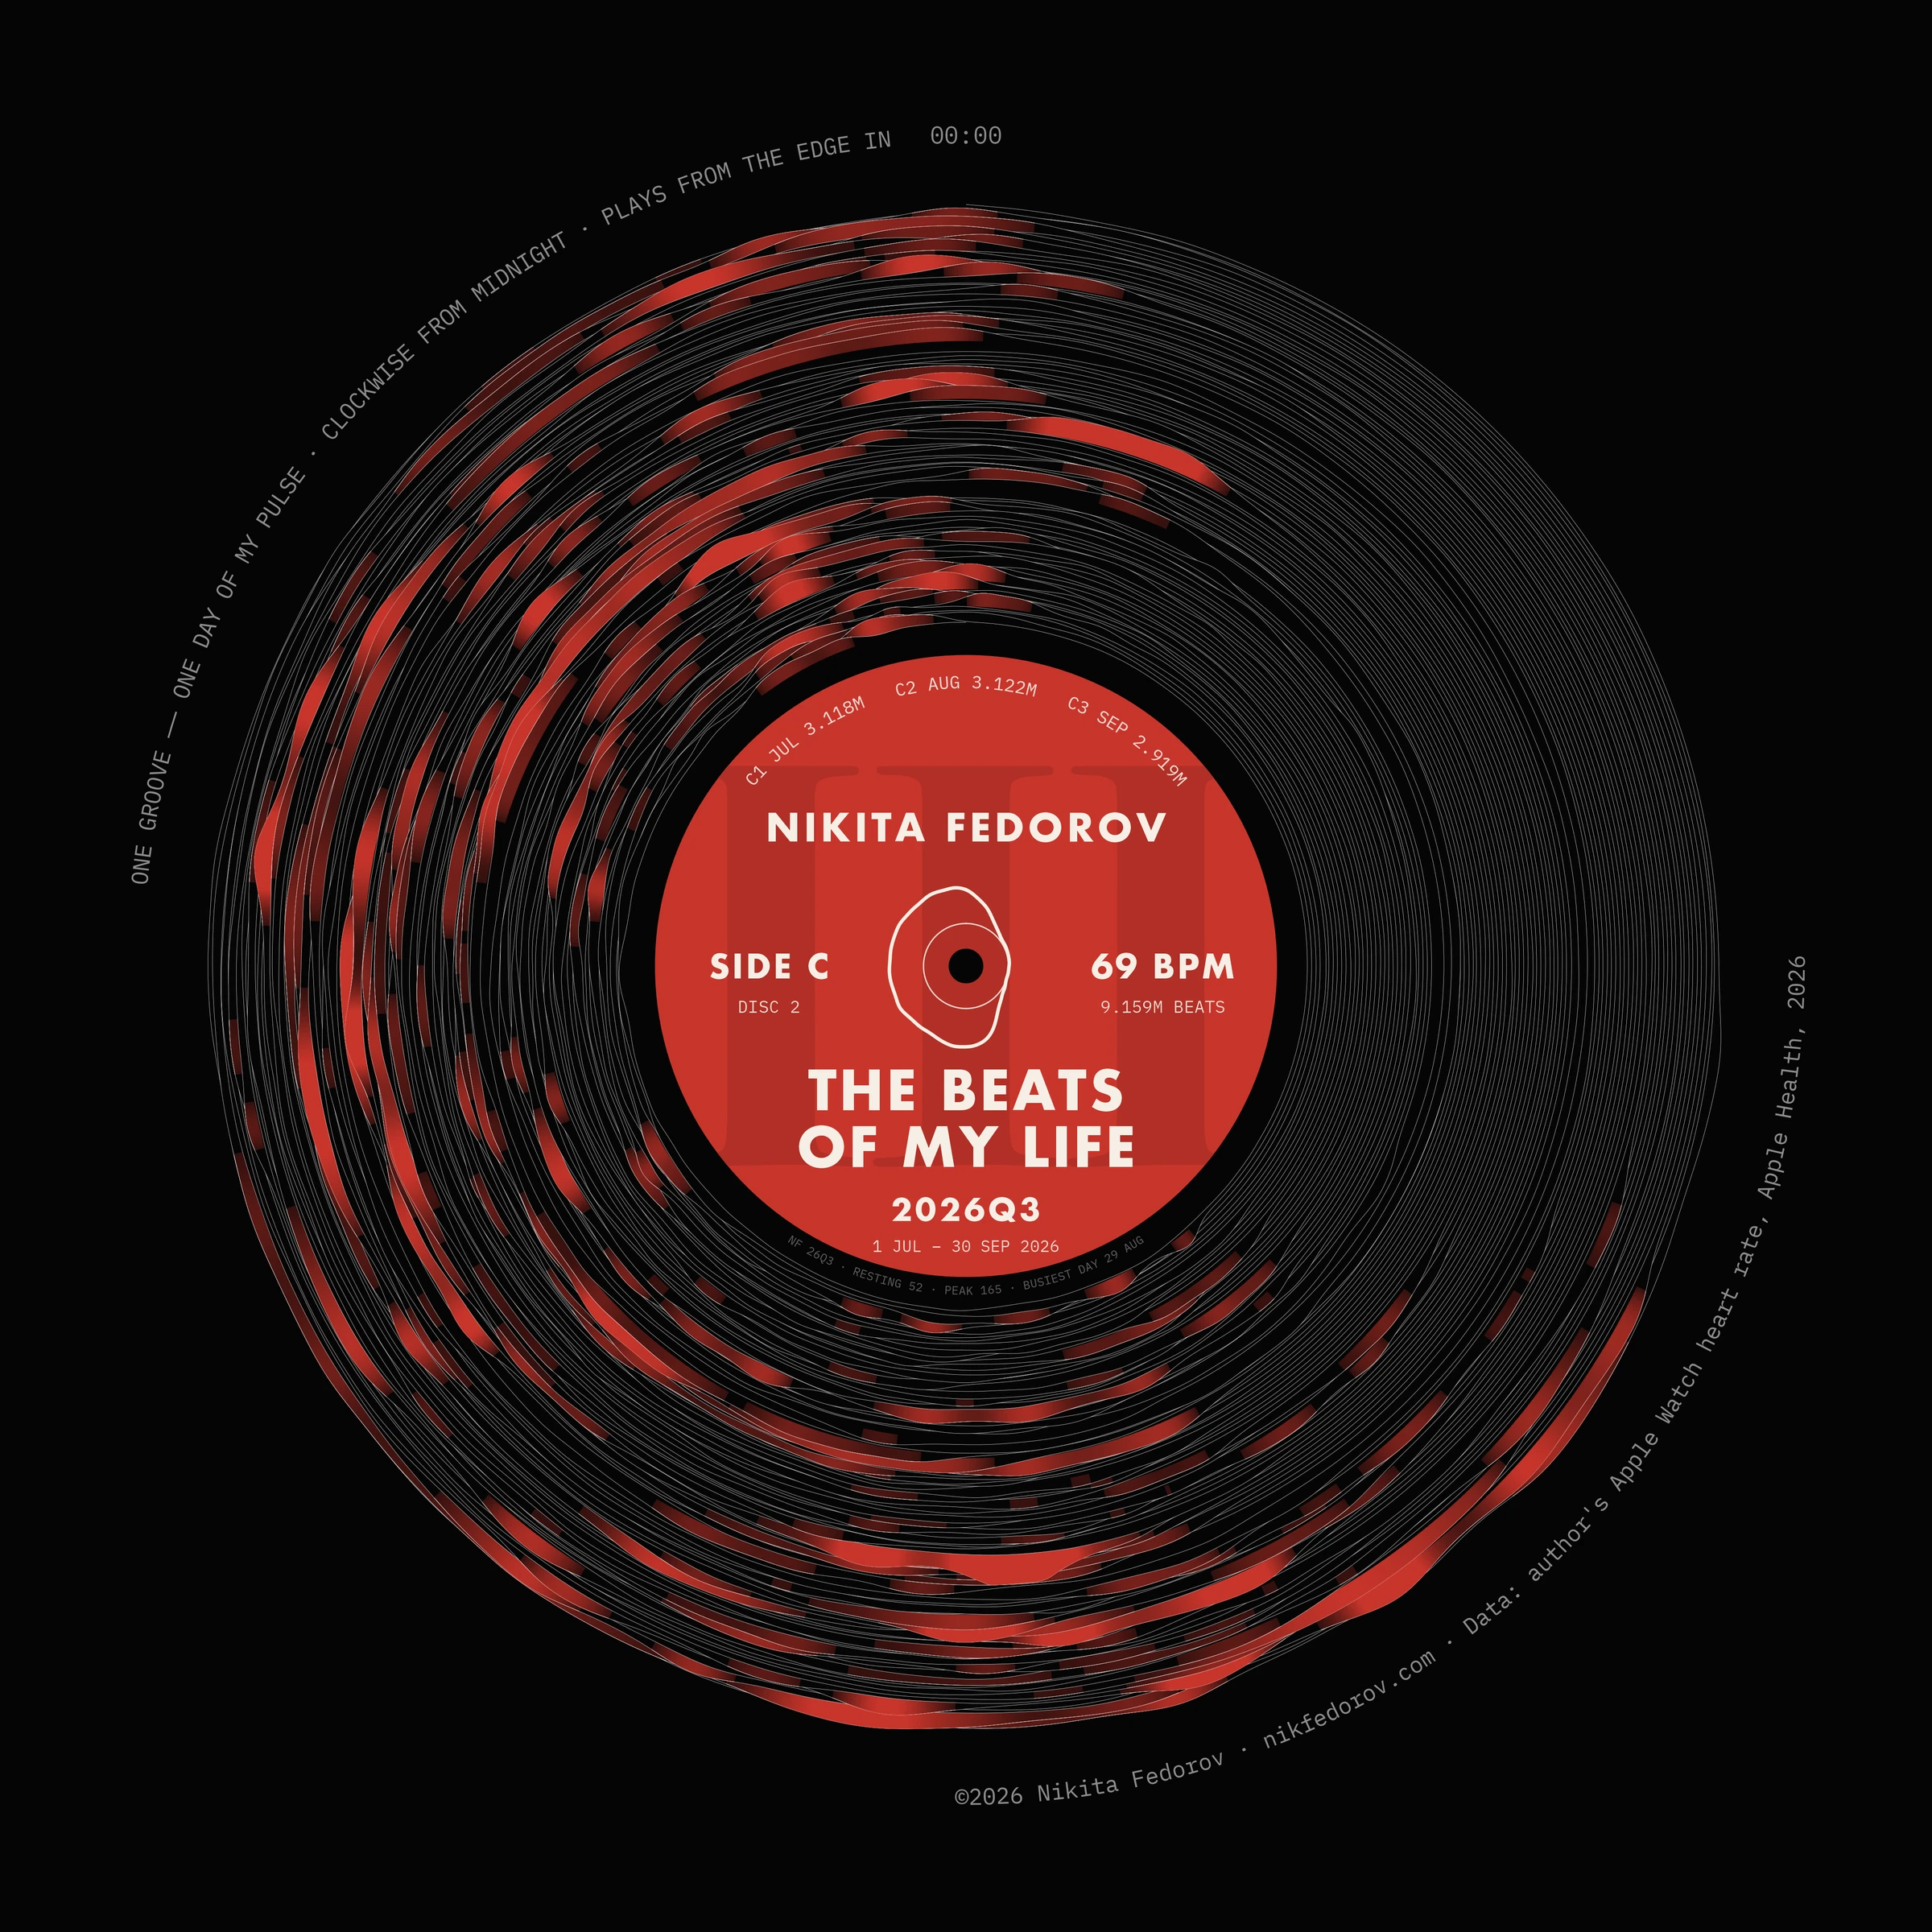
Heart-rate data pressed into a record — one groove per day, clockwise from midnight, playing from the edge in.
- Data
- Apple Watch heart rate via Apple Health
A record of my heart rate, made to look like a record. I started from the sleeve of Joy Division’s Unknown Pleasures, which is a picture of a signal: the pulsar CP 1919, one pulse per line, the lines stacked. I stacked my own days the same way, one line per day from midnight to midnight, and drew nine layouts, first on invented data and then on my own. The one I kept was the record, because it is the same idea turned inside out. A groove is not a picture of a signal, it is the signal, written in a spiral.
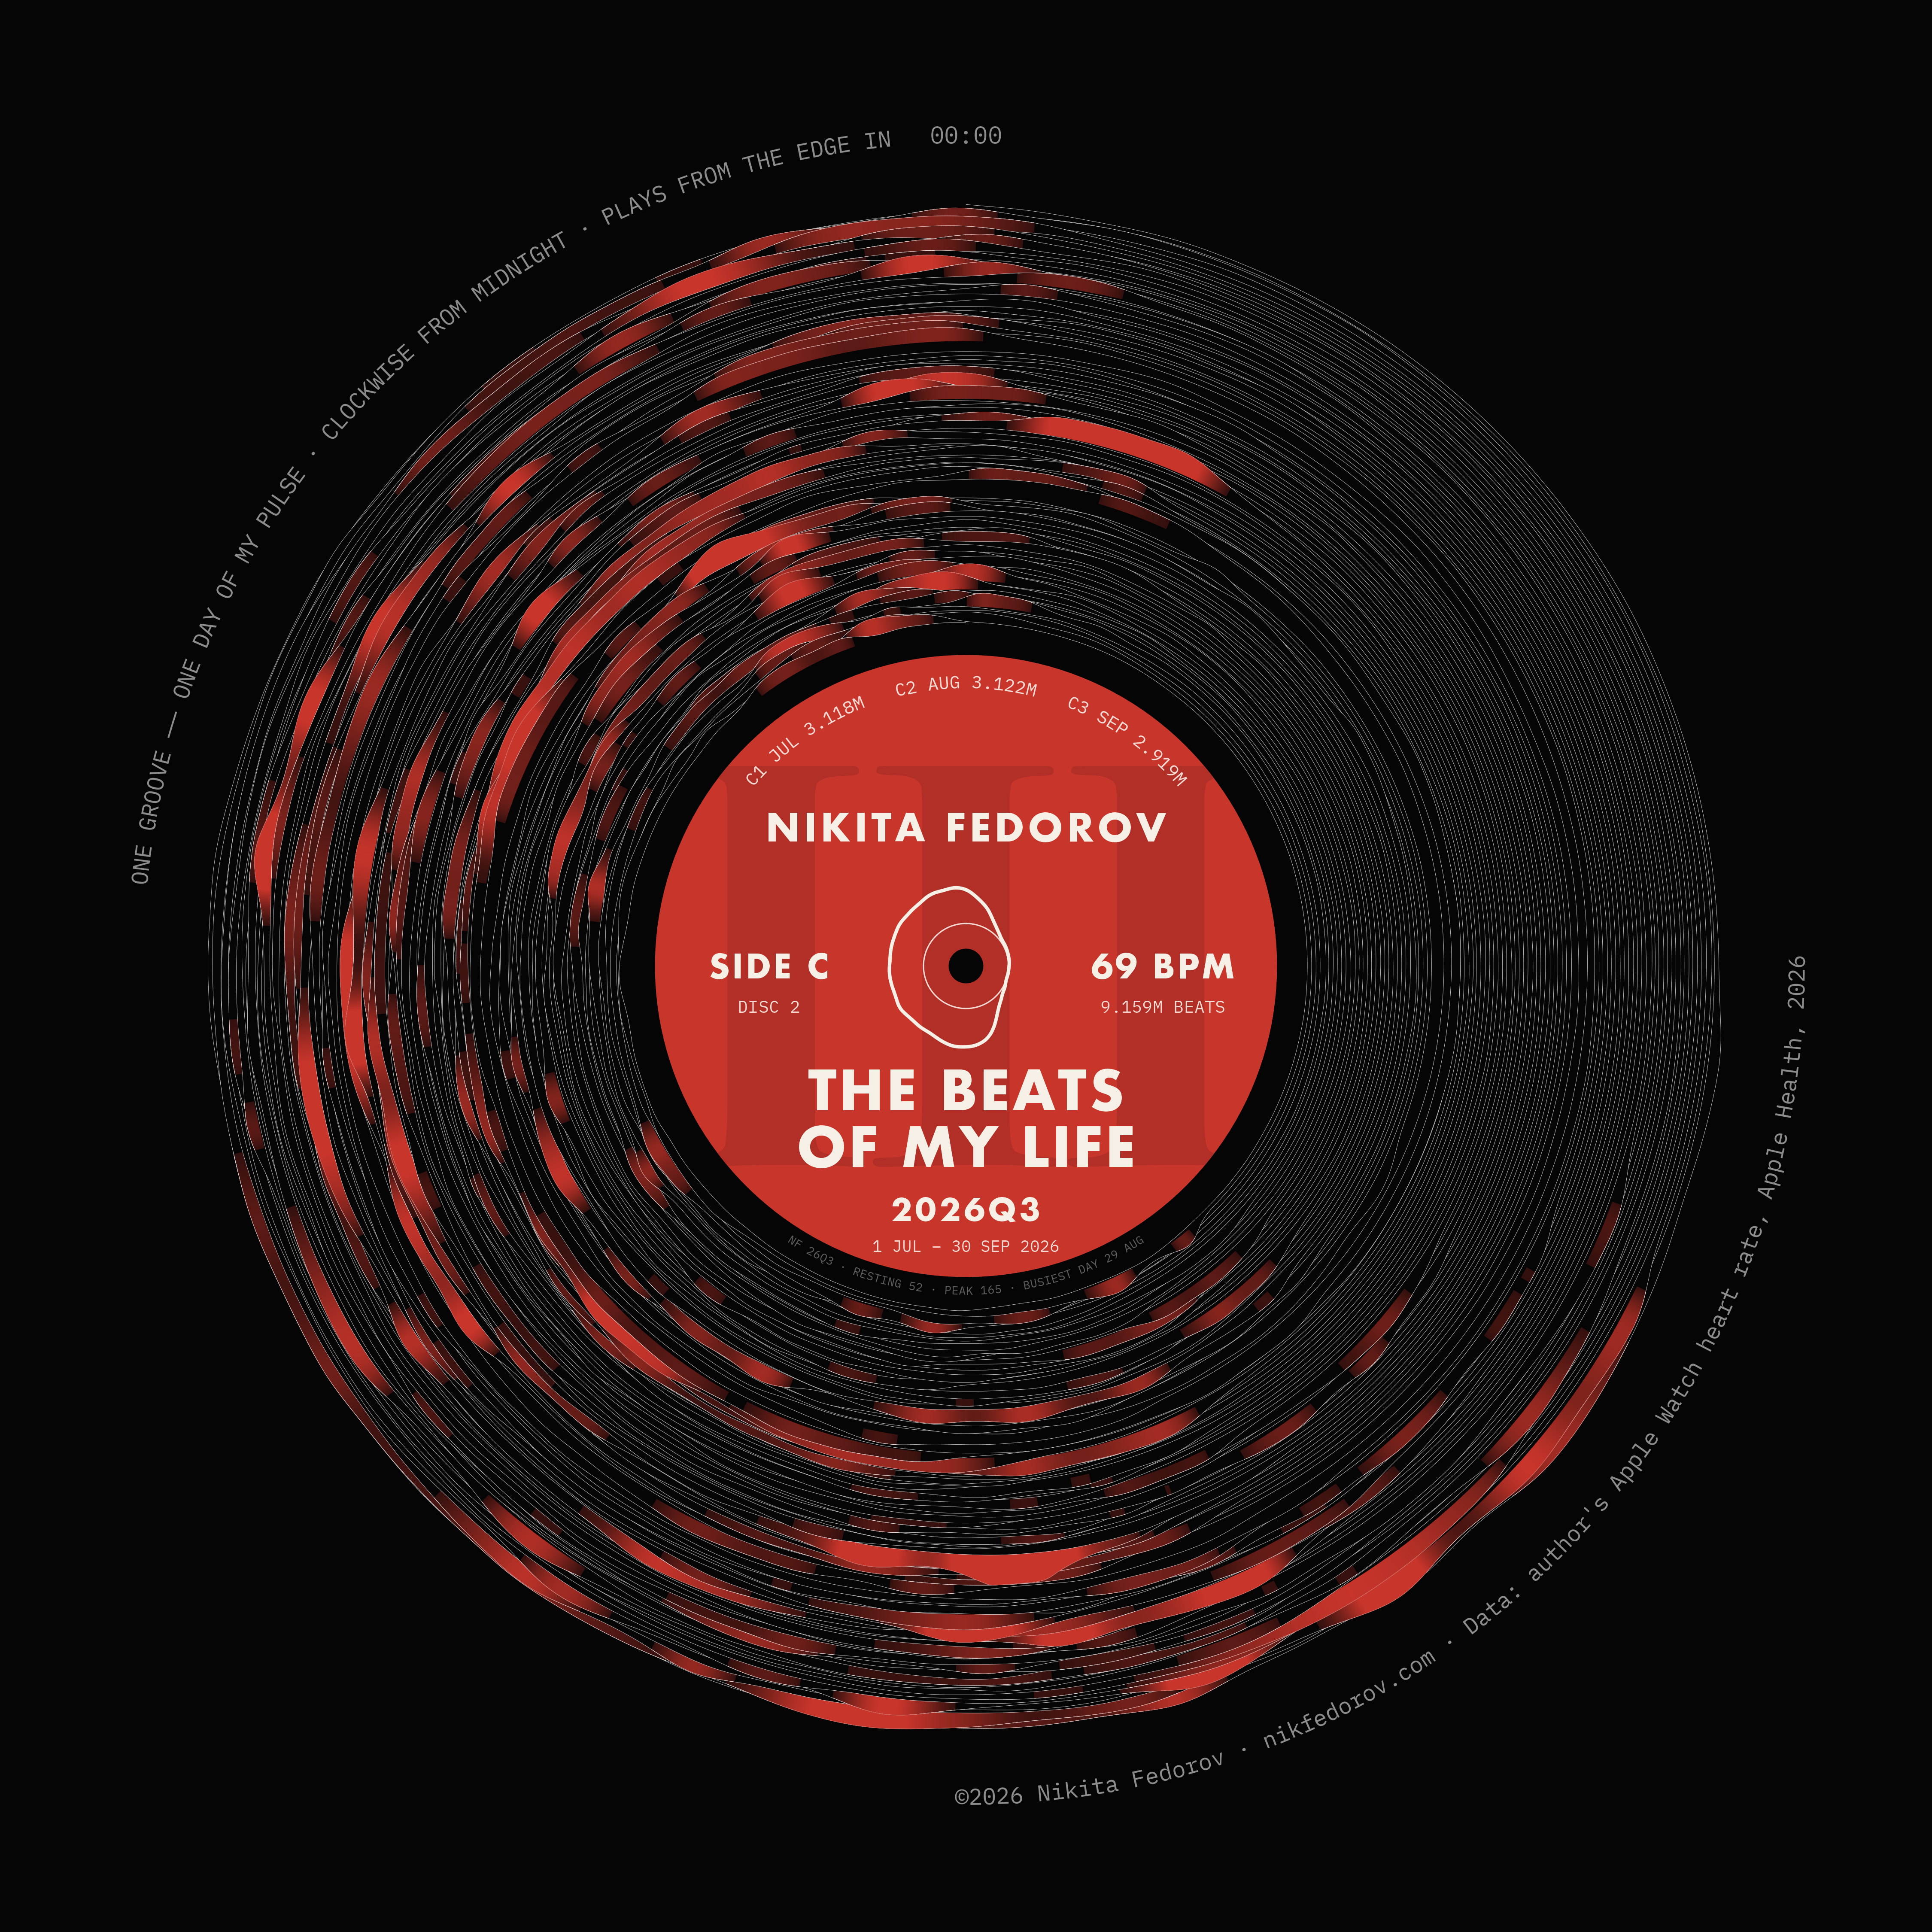
Every turn is one day. It starts at midnight at the top and runs clockwise. I drew the spiral both ways and kept the one that plays from the edge in, like a real record, so the quarter opens on the outside on 1 July and ends at the label on 30 September: 92 days, 92 grooves. My first try took 128 days and the grooves ran together, so the record is one quarter, and the lines are thin, like the track of a needle. Where the pulse rises into its top 10% for the quarter, the groove fills with the label colour and the line turns the same colour. The calm hours stay pale and the busy ones flare red. The colour fades in 255 steps: with fewer, the steps showed when I zoomed in.
A record is also its label, and I worked on that as much as on the grooves. It is a double album: one disc per half-year, one side per quarter, so Q3 is side C of disc 2, and the big Roman numeral behind the text is cut off by the edge of the label on purpose. Where a label prints 33⅓ RPM, this one prints 69 BPM, my average pulse for the quarter. The months are tracks, each titled with its beat count: July 3.118M, August 3.122M, September 2.919M, and 9.159 million beats on the whole side. The ring around the spindle hole is my average day, midnight at the top. In the dead wax, where a pressing plant engraves the matrix number, there is a line of my own: resting pulse 52, peak 165, busiest day 29 August. My name stands where the artist’s would, because a series called My Life needs someone visibly holding it.
What I was after is a chart that you take for an object first and read as data second. From across the room it is a black record with a red label. Closer, the red patches are the hours when my pulse ran highest over ninety days, and every number on the label comes from the data or the calendar. The label is built to repeat: each quarter gets the colour of its season, blue, green, red or ochre, and I tried the same layout on all four quarters and four typefaces, so the next record only needs new data.
Data is the heart rate from my Apple Watch, exported from Apple Health. Beats are the area under the pulse curve on a 5-minute grid. Where the watch was off for more than two hours, the groove stays a flat line, but the count fills the gap from the same time of day in the same month, so a night without the watch is counted at night rates. Made in R, base graphics and ragg.
Source: author’s Apple Watch heart rate, Apple Health, 2026.